Hi, my name is Jason Kao. I make data visualizations and data journalism. Here are some of my
past stories. I am open to freelance opportunities.
The photos below are by
Ahmad Salem, a photojournalist in Gaza,
unless otherwise noted. If you are able, please donate to him and his family
here.
–– –– ––
Satellite Analysis Shows Where Mass Graves Were Found by Gaza Hospitals (Bloomberg News, April 2024)
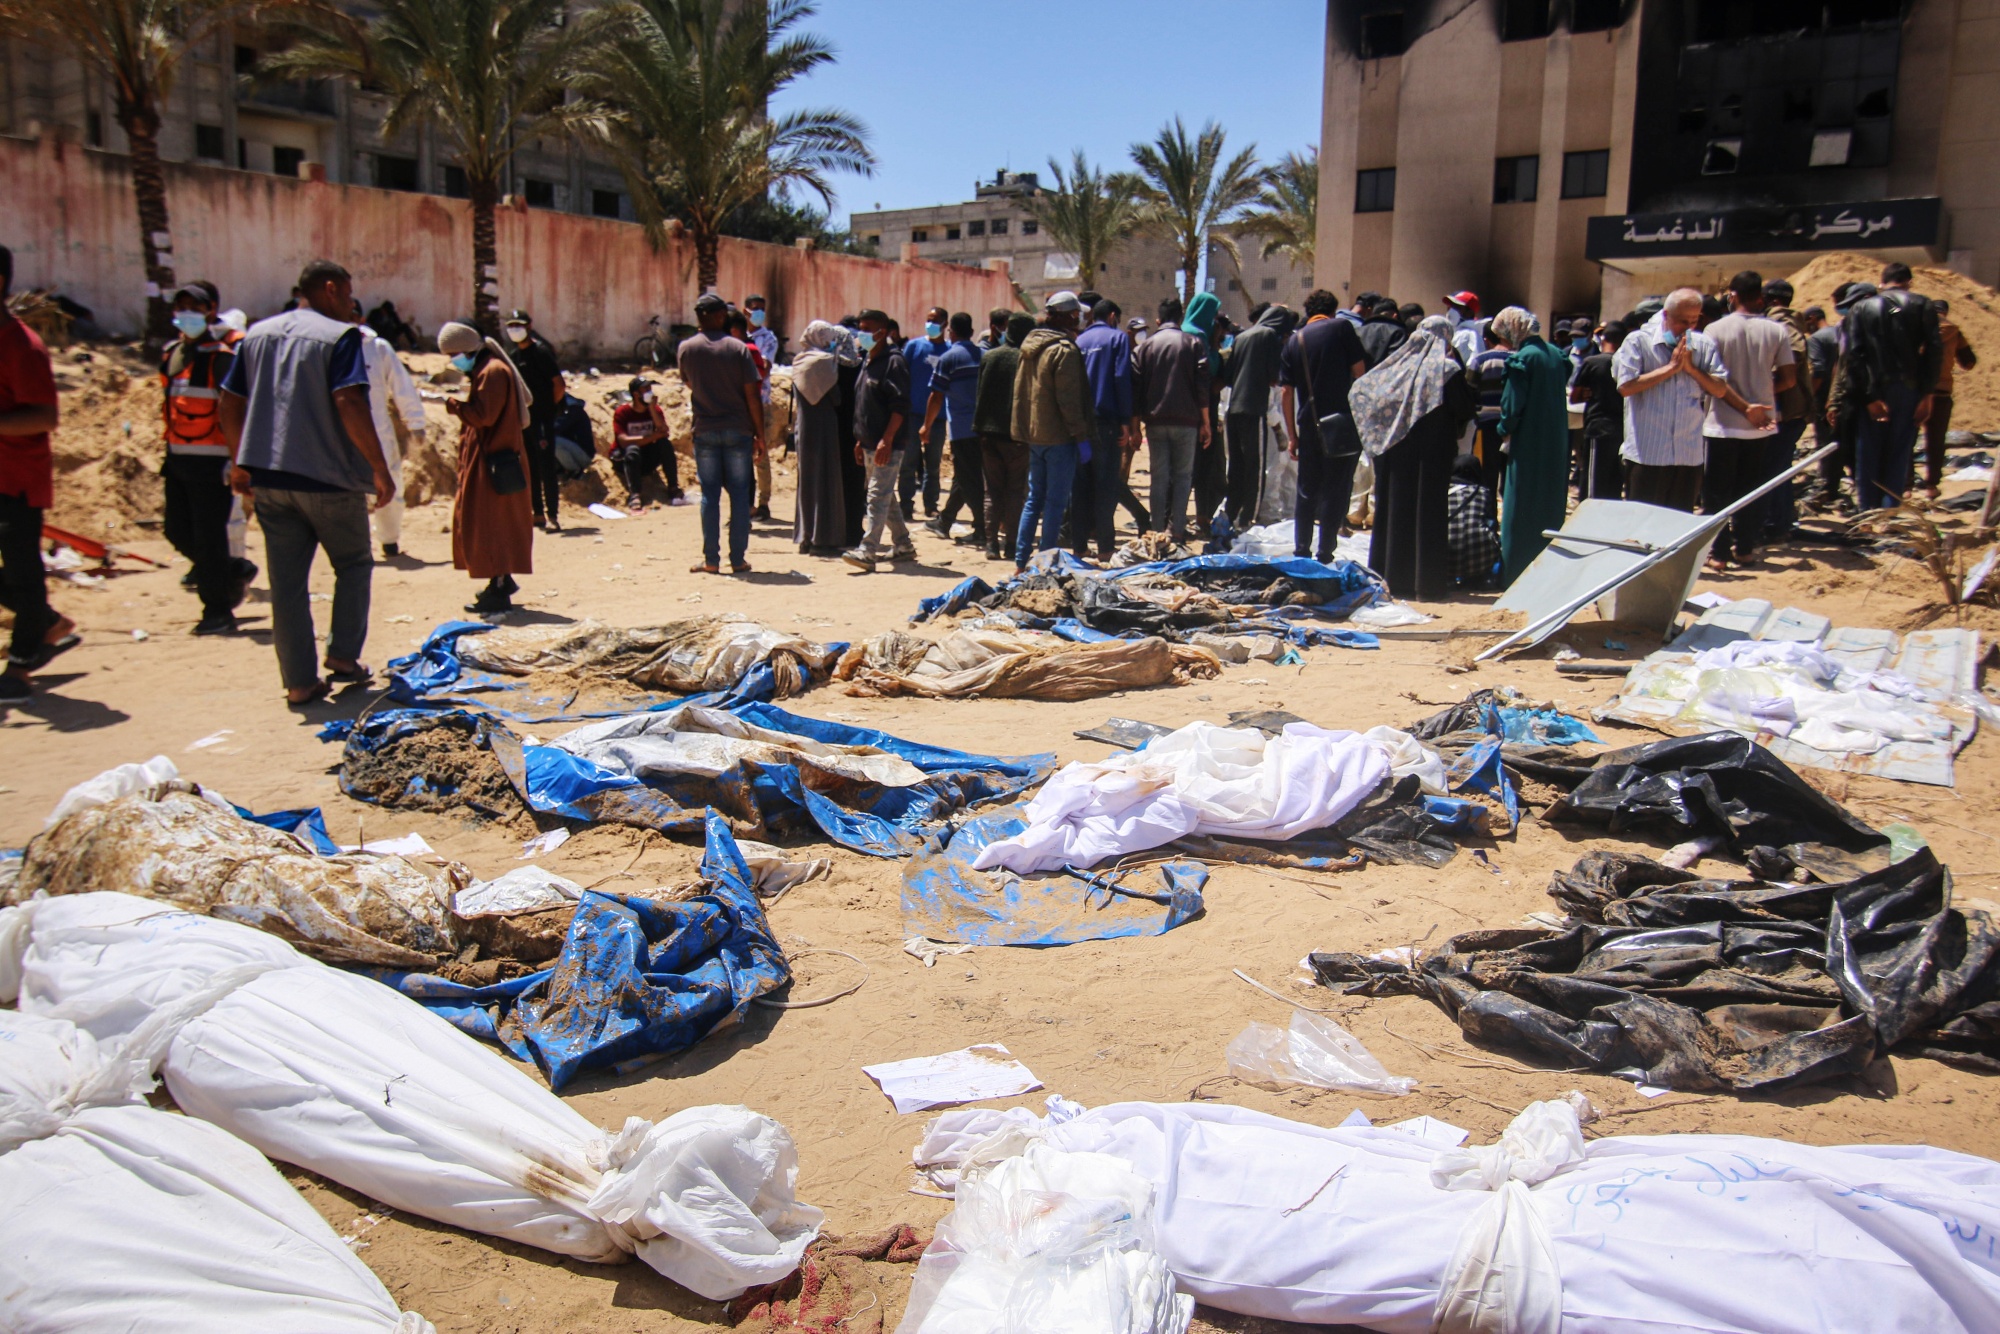
Israel attacked two hospitals in Gaza, leaving mass graves in their courtyards.
Photo by Ahmad Salem.
Gaza Reduced to 42 Million Tonnes of Rubble. What Will It Take to Rebuild? (Bloomberg News, Aug. 2024)
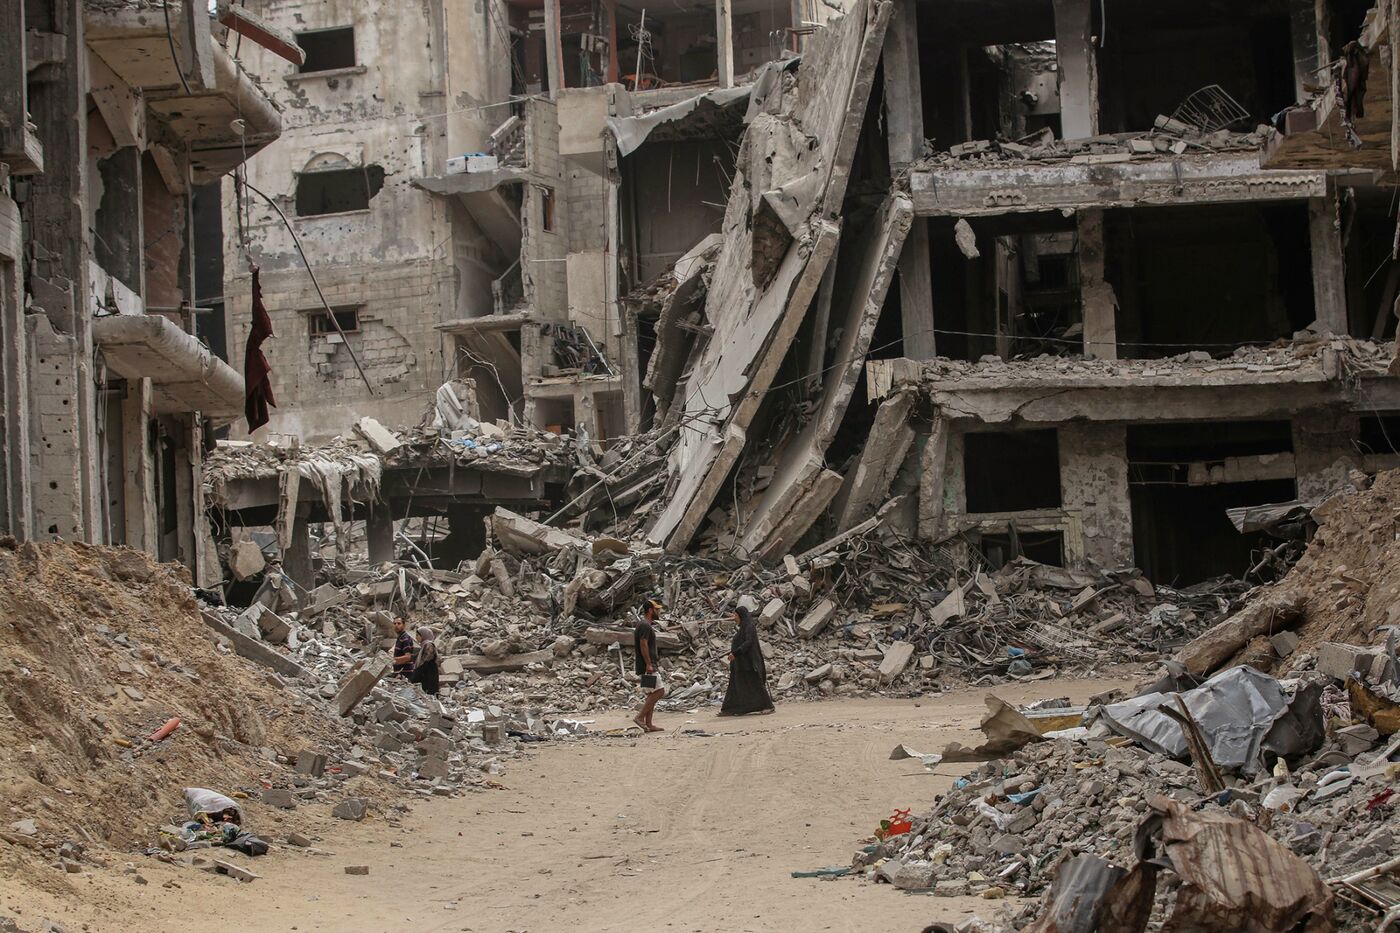
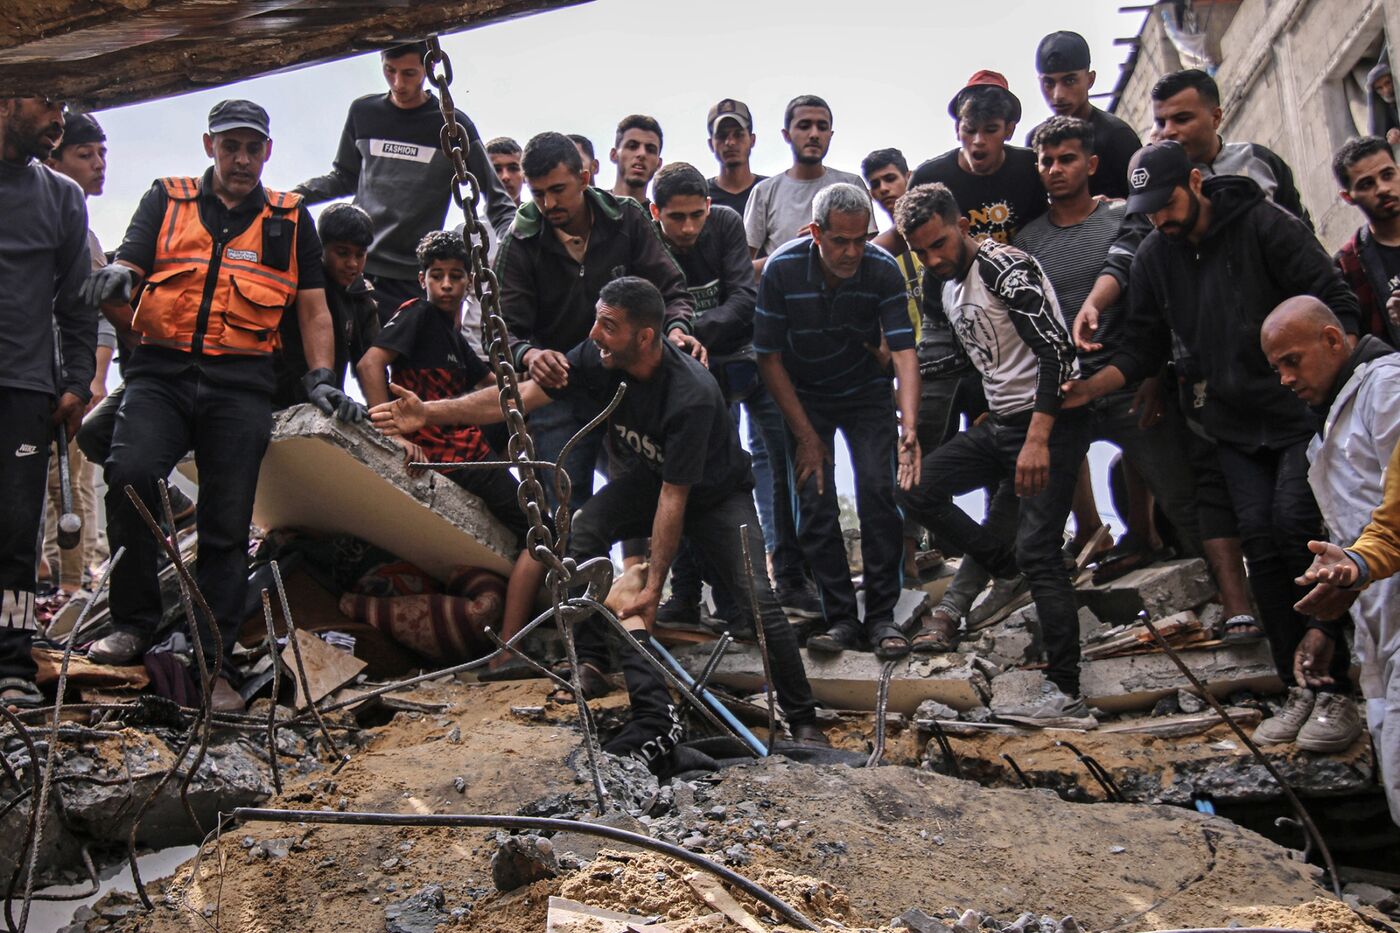
Photo by Ahmad Salem.
Satellite Imagery Shows Gaza’s Destruction and Resilience With War Unresolved (Bloomberg News, March 2025)
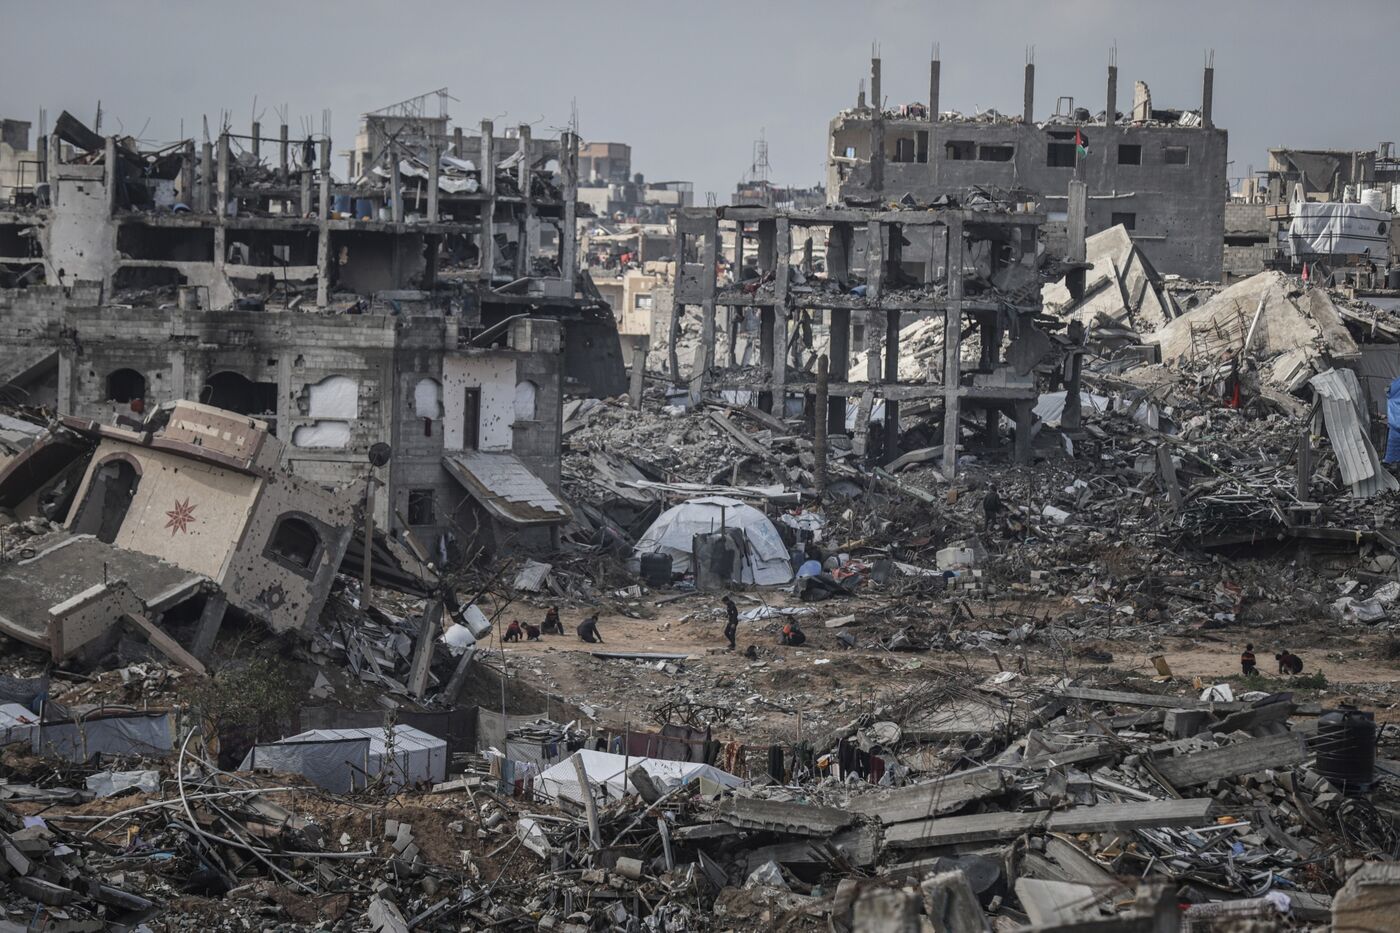
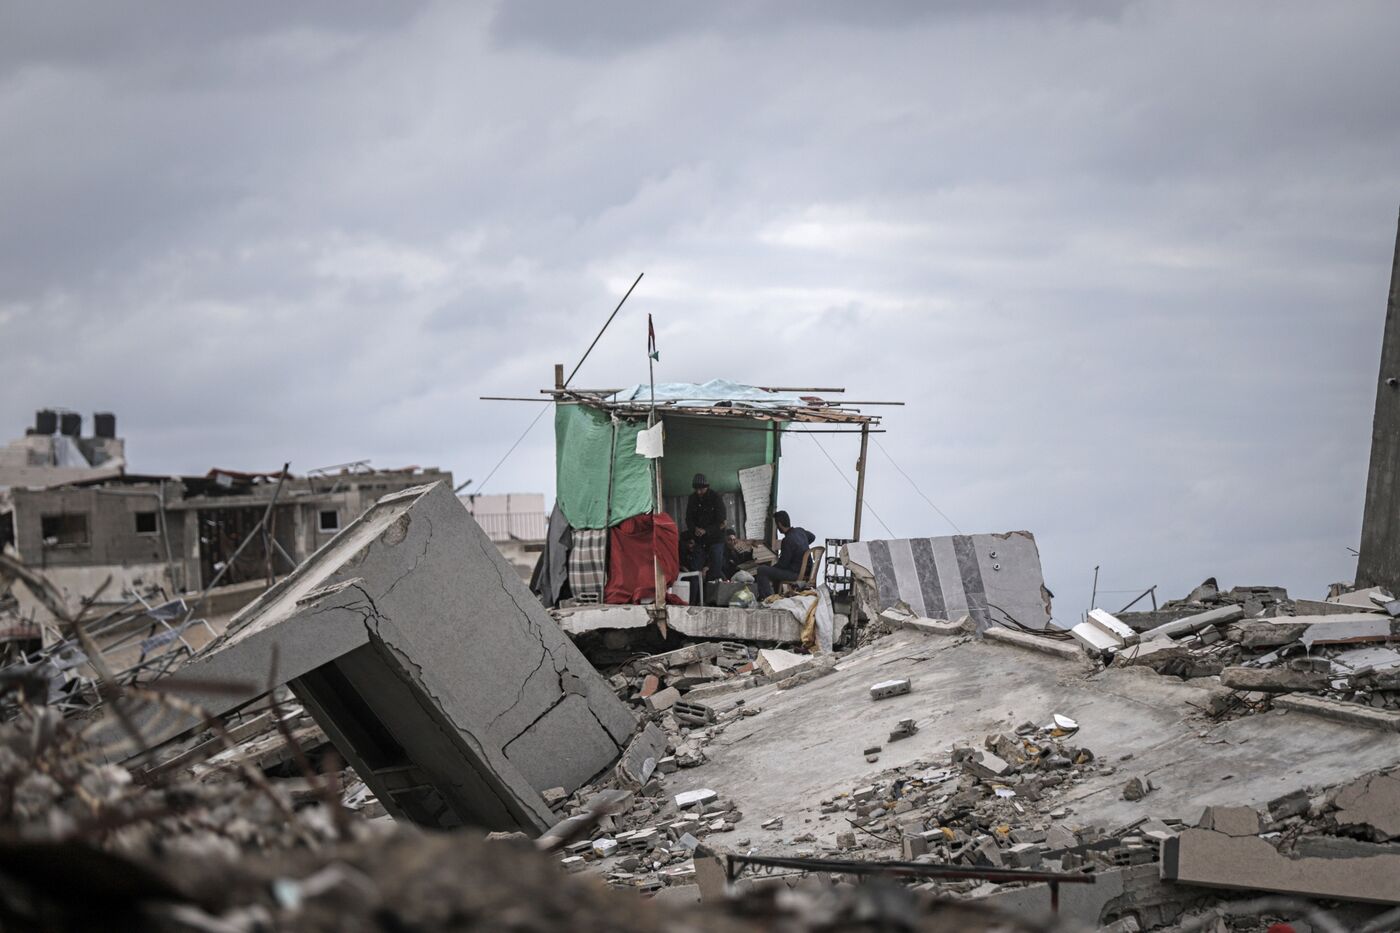
Photo by Ahmad Salem.
A Detailed Map Shows How Airstrikes and Refugees Reshaped Rafah (Bloomberg News, April 2024)
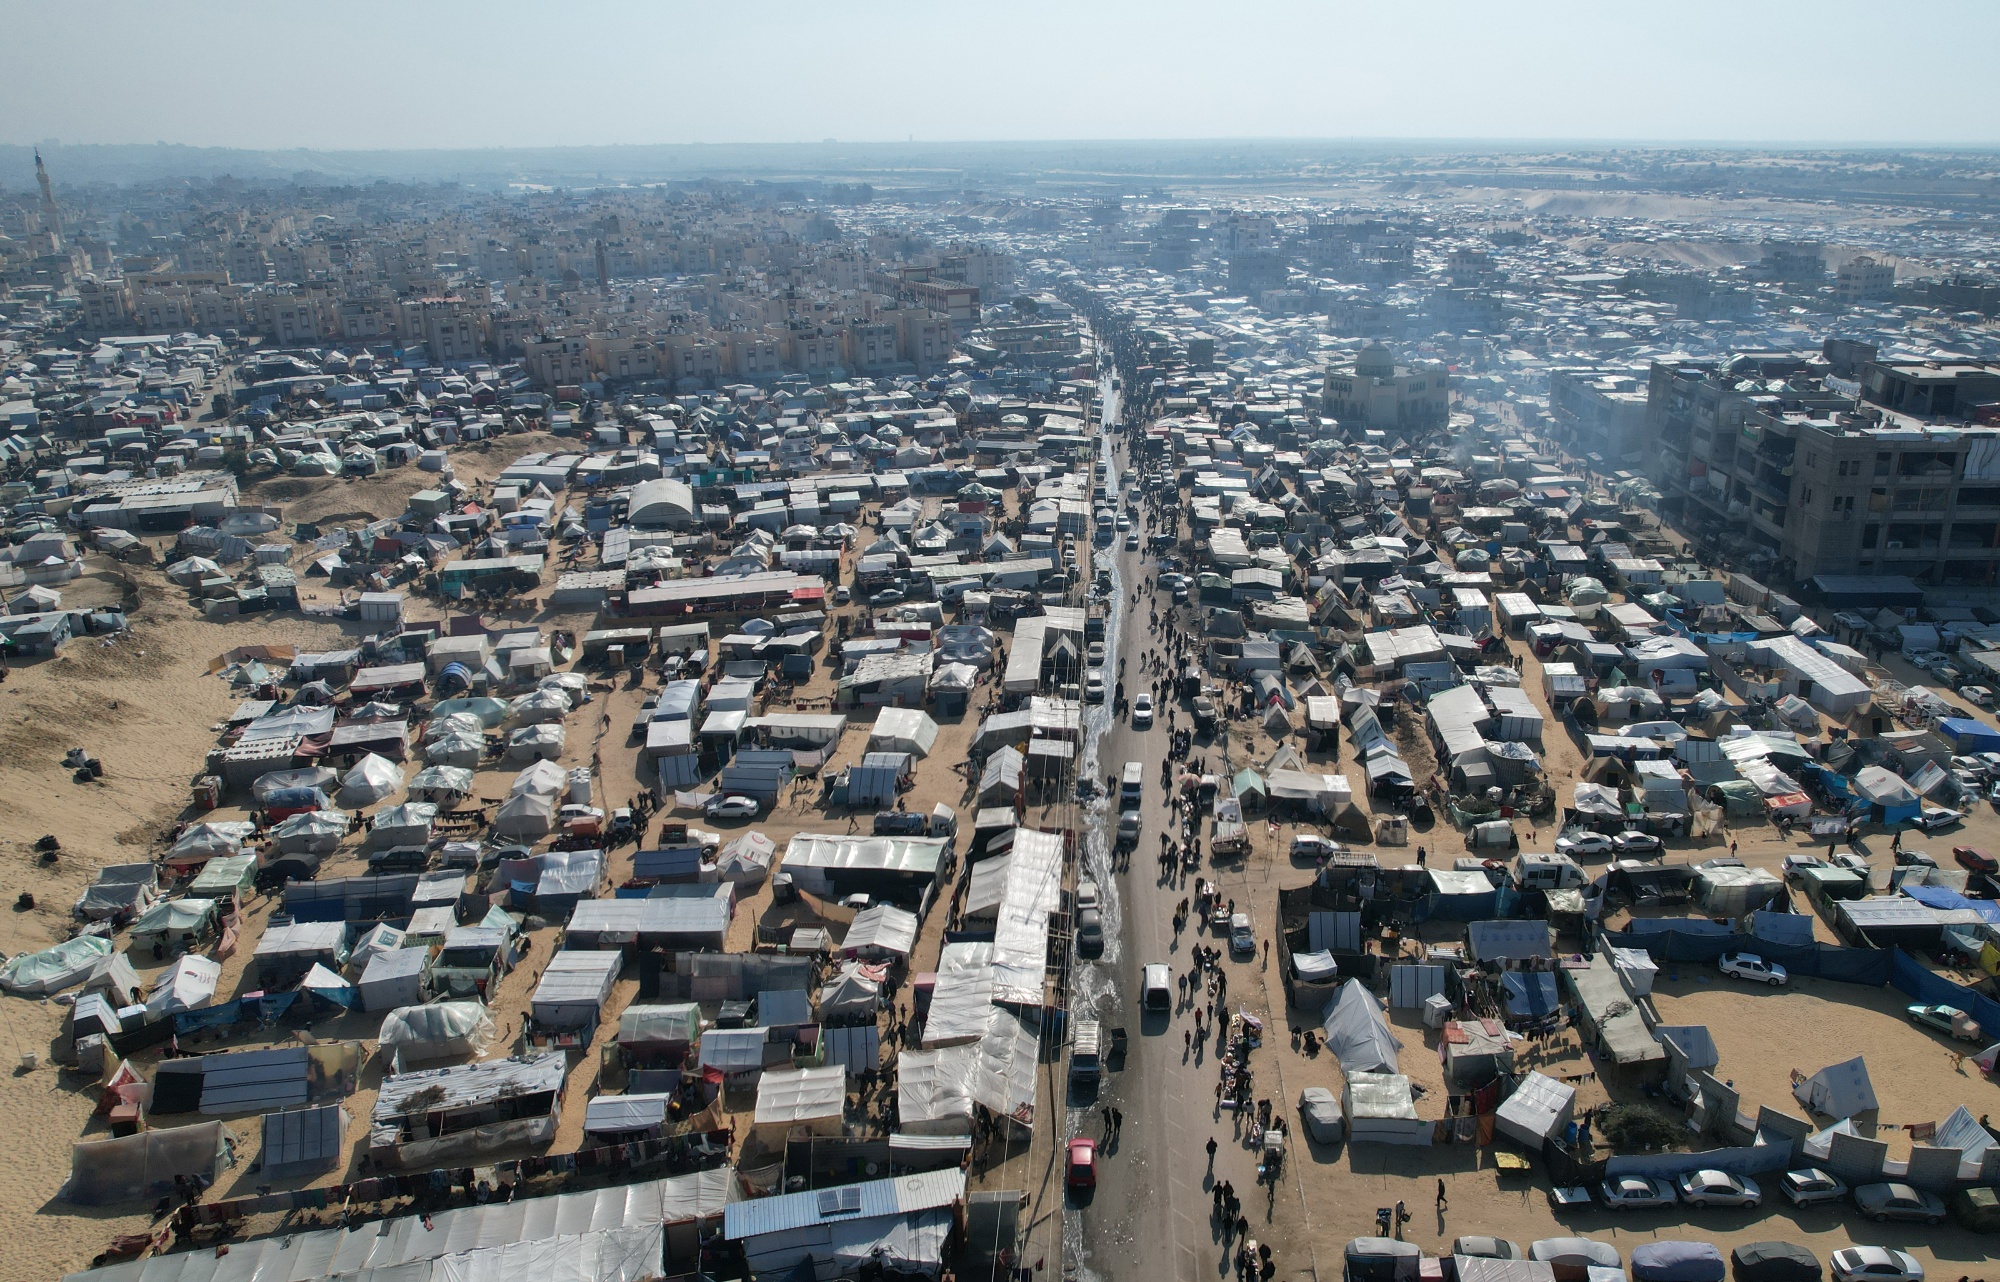
The story shows how crowded Rafah was before Israel invaded by detecting tents from satellite imagery.
Photo by Ahmad Salem.
Paralyzing Curbs on West Bank Obstruct Path to Palestinian State (Bloomberg News, Nov. 2024)
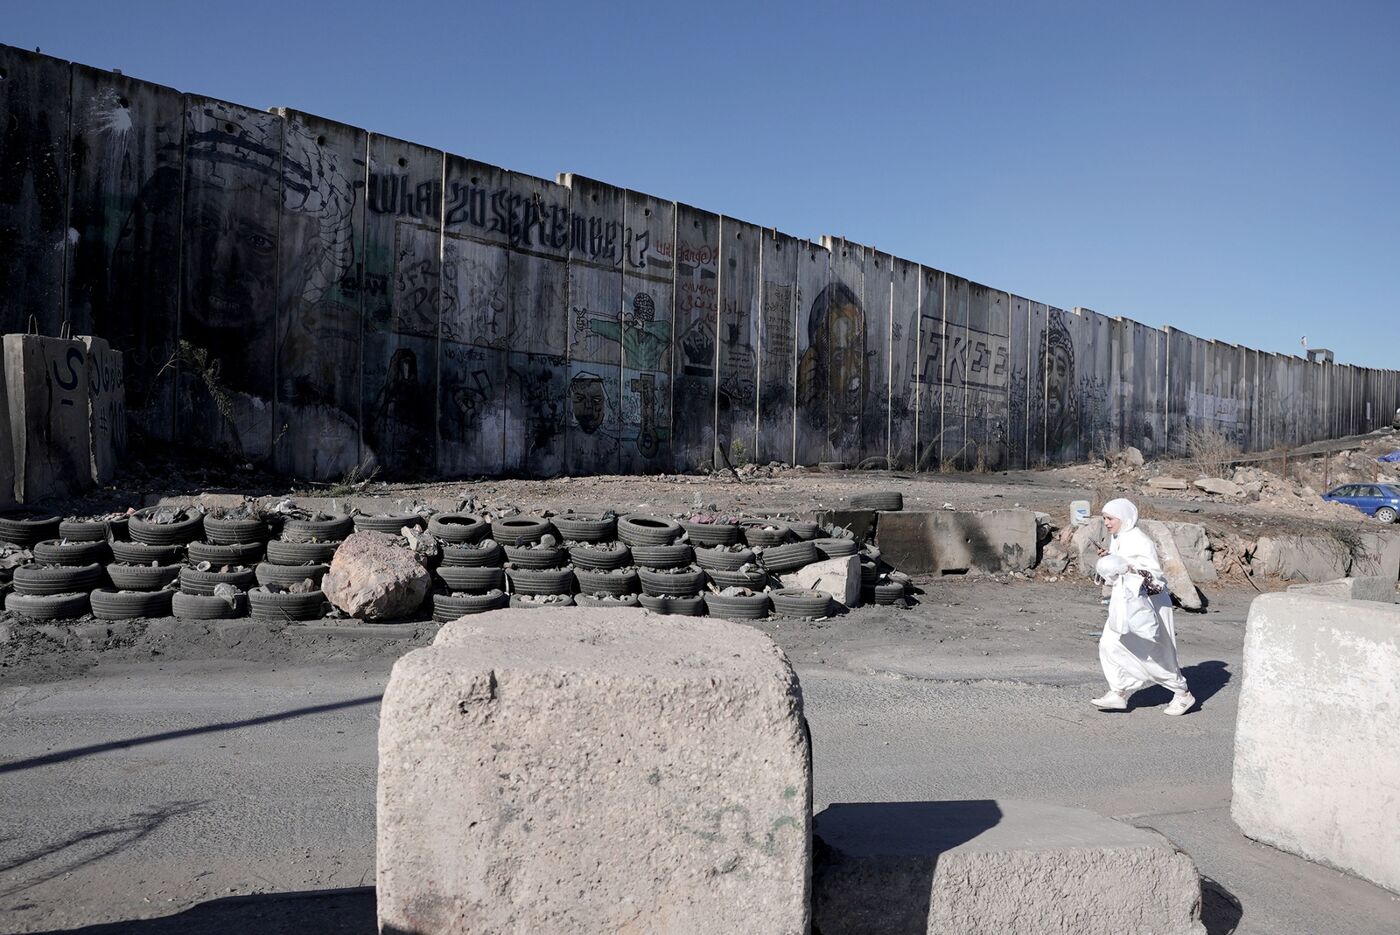
Role: We pitched a story on Israel’s increased repression in the West Bank. I designed and developed an interactive map of the occupation’s physical barriers.
Tools: WebGL for animation; JavaScript/Svelte for interactivity; D3 for vector mapping; GDAL for preprocessing. Photo by Sergey Ponomarev/Getty Images.
Where New York’s Asian American Neighborhoods Shifted to the Right (The New York Times)
Role: Pitching, reporting, processing and analyzing data, and coding the visualizations.
Tools: Python for data processing; R for data exploration; mapshaper for generating map layers; Svelte for presentation
Body Cameras Were Sold as a Tool of Police Reform. Ten Years Later, Most of the Footage Is Kept From Public View. (ProPublica)
Role: Design and development of main interactive elements.
Tools: Svelte/Javascript for interactivity; ffmpeg for image processing
React Scrollama: A library for clean scrollytelling in React
Role: Creating the React version of Scrollama! And being an open source maintainer.
Texas’ new race and social studies law prompts McKinney school officials to cancel Youth and Government class (The Texas Tribune)
Tools: Traditional investigative reporting; FOIA requests. Photo by Eric Lee.
A Memorial for the Children Lost to Stillbirth (ProPublica)
Role: Assisted with the coding of Zisiga’s designs.
A Bird’s-Eye View of How Protesters Have Flooded Hong Kong Streets (The New York Times)
Tools: OSINT; Illustrator for presentation
Hungry, Scared and Sick: Inside the Migrant Detention Center in Clint, Tex. (The New York Times)
Role: Investigative reporting and annotation on top of Jeremy White’s 3D models.
Tools: OSINT; traditional investigative reporting; Illustrator for presentation